5-minute digital history experiment: Places Left Behind by Rail
View Larger Map
There I was, dutifully taking notes on Samuel Shaen's Review of Railways and Railway Legislation (1846), and linking up his review of railway statistics to the larger themes in my abstract mind-map of themes important to the history of British railways.
That mind-map, which I've blogged about below, allows me to organize my citations, quotations, and thematic notes under an overlapping series of larger, abstract thoughts, which are helping me make provocative connections early in the research process. One big thought in my mind-map is "The Problem of the Geographical Periphery," which has to do with sectional politics resulting from where the railways go and don't. It's related to other interesting thoughts like "The Power of the Railways to Transform Geography" and "Places Left Behind by Rail." Shaen gives a nice list of the English county towns that still aren't directly hooked up to London in 1846. As you can see, there are a bunch of them.
Since I'm trying to think through where the rails go and don't on the level of geography, it occurred to me that it would be really stellar to have a map.
Here we go, in five-minute experiment form.
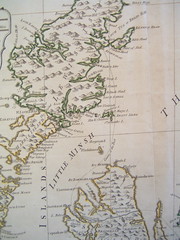
I'd never done it before, but I'd heard right. Producing your own map of points (or lines, or points and lines linked to photos and text) is ridiculously easy now. Five minutes, probably less. Here they are, the nine towns in question. I know it's not a miracle, and it doesn't tell you everything you'd want to know about the geographical periphery by a long stretch, but isn't it nice to see them? See how they're all on the west, not the east?
A lot of them are near agricultural districts. Rail immediately served manufacturing, mining, and shipping points. Agricultural centers were left behind, and British agriculture almost immediately started the long slow path into decline.
It gets better. If you zoom in on the map (as I did when I was placing the little pointers), you start to notice that a good number of these towns still retain their eighteenth-century shape: a very small net of streets hugging the main highways. Getting left behind by the rail in 1846 permanently retarded their progress, as rail sped up the differential between industry and places left behind.
View Larger Map
The plethora of tools like this really come together when a researcher is trying to assemble a series of connections and ideas to present to other scholars.
All of my tools here serve traditional purposes. The mind-map I'm showing you serves a very traditional purpose: the outlining of paragraphs that will comprise the backbone of the chapter on railway and political economy in the 1830s and 40s in the book manuscript I'm preparing. The map above serves, for the moment, as a visual aid to my own imagination; if I can add a bit more data to make sense of why the periphery looks the way it does, that map might become a visual aid to the book itself.
I believe that it's the small tools like these that enhance our skills at visualizing arguments, that make possible small 5-min experiments, where the shape of how digital technology is transforming academic research is mostly clearly visible.
That opens up the room for experiment and risk-taking behavior. Despite my interest in geography, I'm not adept at map-making, and I've shied away from mapping my roads and trains for a long time. The 5-min experiment lowers the threshold for new ways of thinking. It makes it possible for political/social historians like myself to mess around outside of my comfort zone.
If we give grad students and undergrads the room to try this sort of thing, it's this sort of messy sorting of ideas and launching of experiments that could come to characterize humanities pedagogy: start with a small mapping experiment, see if you can identify the patterns at stake, keep mapping and moving until the project takes on its own form.
A characterization of humanities pedagogy based on risk-taking, insight, and pattern-finding is very exciting. It pushes past the monotony of the college essay and re-emphasizes the skills of perception upon which the humanities have traditionally been based. It creates richer minds and broader sets of experience.
I won't press my claims too far, but let me rest with this conclusion: I'm excited about my five-minute experiments and the direction in which they tend.
posted by Jo Guldi at 7:29 AM
![]()
![]()


6 Comments:
Of course, the other element of the map is that it perfectly represents the old agricultural history distinction between highland and lowland agricultural districts, that in turn reflect the underlying geography of England (it is a lot cheaper putting a railway through the lowlands!). As a result you also get a high correlation nucleated and non-nucleated village patterns (the mutton of lamb towns you describe as 18th c.). Hmmmmm.
wow, Tim, thanks! that's golden!! any chance you know a quick citation for me? :)
I would always start with Joan Thirsk's eight volume, Agrarian History of England and Wales - which is underpinned by precisely this distinction. The same series of regional distinctions and assumptions (clay/loam et al) also underpins G.E. Mingay's 'The Victorian Countryside'. If you want more recent stuff, the distinction is at the core of most poor law studies, particularly Steve Hindle's On the Parish, and Steve King, Poverty and Welfare in England, 1700-1850: A regional Perspective. And is used as the basis for discussions of an open vs closed social patterning.
You might also want to have a look at Neil Davie's recent critique, at: 10.1111/j.1467-6443.1991.tb00114.x
The whole thing gets very technical very quickly, and is built on the kind of parish by parish understanding of the landscape that is difficult to develop except on foot! If you just want the joy of reading something wonderful (and I am sure you have read him), why not look again at Hoskins, The Making of the English Landscape.
A thousand thanks. I came across Thirsk and Mingay a while ago when reading for quals, but without enough context, their geographies didn't stick in the mind. It'd be really interesting to speculate how 5-min mapping experiments like this would make things different for the geographically-minded grad student!
You know me well. I'm a HUGE fan of Hoskins. For all that he has no use for anything that happened after 1800.
you've probably seen this, but:
http://www.ted.com/index.php/talks/hans_rosling_shows_the_best_stats_you_ve_ever_seen.html
I know this is kind of "late to the party" but I just started following your blog and found this post browsing among the backlist.
If you haven't seen it you might be interested in this digital humanities project:
http://railroads.unl.edu/
for some innovative applications of GIS data to asking questions about railroad expansion in the US.
The lead investigator William Thomas (at Nebraska Lincoln) gave an interesting talk about how the project is working on expanding and integrating its visualizations of geographic data here in London last fall.
Post a Comment
<< Home